 Zoe Palmer
8 secrets to designing viral b2b infographics
Creating captivating b2b infographics that can charm and inform simultaneously can sometimes be a bit like geo tagging Dory from Finding Nemo. Where...

Storytelling and data can seem like unlikely companions – one soft and pliable, the other hard and fixed, destined to tell their own stories. However, when the emotional connection of qualitative is combined with the rational appeal of quantitative, you can create content that is powerfully effective, memorable, and persuasive. In fact, data storytelling is about achieving strong cut-through in the b2b content clutter and should be in the toolkit of every marketing professional.
Data storytelling takes narrative forms of marketing and adds data to strengthen its assertions. Let’s dive in and find out more about this powerful form of content.
Let’s look at a stat right now – it’s a doozy. In 2024, around 7.5 million blog posts are being published every day. This massive volume might explain why you are experiencing some challenges with your content. Do any of these sound familiar?
Adding data insights to your marketing could be a game-changer. It demonstrates that you’ve taken the time to find relevant, quality data to make your point, or that you have gathered and analysed that data yourself to provide value to your audience.
This can be transformative to your image, especially if you’re in an industry that is often pigeonholed as dependent on emotional appeal. At the same time, the right data can showcase your creativity and personal connections with your audience.
In addition, when well-executed, you can bypass cognitive barriers to your sales and marketing spin and convey messages almost subliminally. Data and numbers carry truth and dependability with them . When used with well-crafted storytelling, your audience can feel your message through the narrative and rationalise it with numbers. Double cut-through!
Let’s look at how data storytelling can captivate and engage b2b audiences.
Chances are that your b2b audience is busy, with a surfeit of messages and calls to action being pushed in front of them every day. The right use of data can create the double-take you need to draw them in. There are several ways to do this.
People love reading about themselves, especially when it’s something they didn’t know about themselves. If you can use the data you have about your audience and show them that you know them, it can spark an interest more likely to turn into action.
Example: You are an email marketing provider and you put together a blog about the most popular and effective emojis used in headlines. In the email to individual recipients, you can mention which are their top five most frequently used emojis, and to read on to find how their choices compare to everyone else.
You might be unsure whether you have the resources to research your audience. Don’t worry, you don’t need a team of private investigators! In fact, a smart CRM can gather precise and useful data for you and give you options for doing targeted data gathering. The HubSpot CRM gathers the essentials such as emails, website engagement, and lead scoring, as well as advanced insights like customer happiness metrics and customer churn reasoning.
Example: You use the data gathered by your CRM and find out that people are not ordering from you because they find you “too expensive”. You are able to make changes and inform your audience that you’re aware cost of living is putting the squeeze on spending, and that you now offer free delivery for orders over $50.
Data can be overwhelming, and as easily as it can overwhelm you, a bunch of random stats can make your target audience switch off. Whether you’re using data you’ve gathered yourself or are using reliable sources, make sure you’re sharing insights that matter to your readers.
Example: You consult your client personas and remember that your audience looks to you for practical, forward-thinking marketing insights. Now you create a data-rich blog featuring user stats of ChatGPT vs Gemini vs Midjourney, satisfying your reader’s curiosity about using AI in marketing.
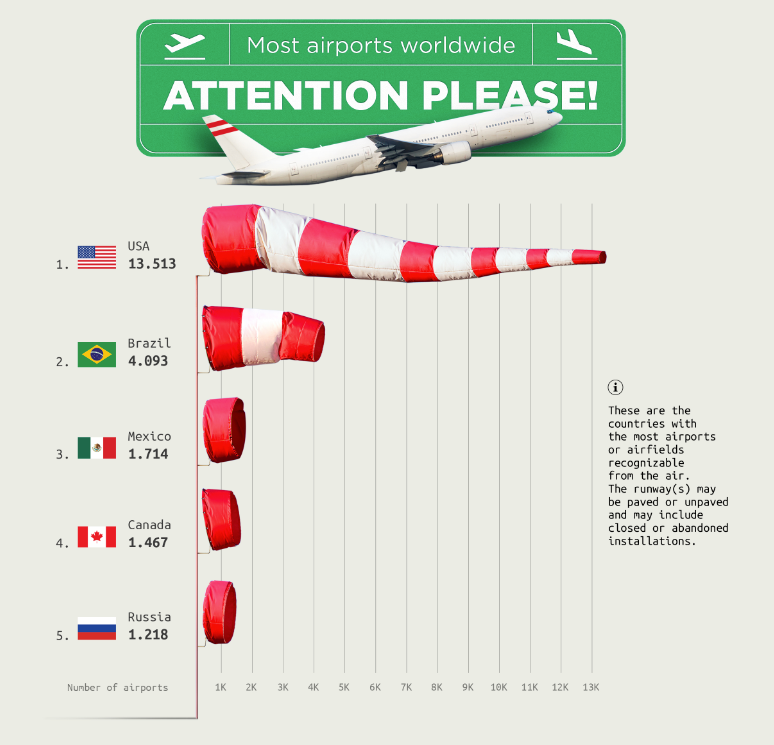
When you think ‘data’, you might just think numbers, but these can be turned into visually attractive images that speak a thousand words and make dry numbers more accessible. You can delight your audience with your creative use of stats!
Example: As a wholesale IT distributor, you create a fun and colourful infographic to show the timeline of advancing technology in the last 10 years, including the advantages of upgrading, to inspire your audience to consider replacing clunky, old technology in the office.
Many companies are successfully using data to improve their storytelling, and you may have already enjoyed at least one or more of these.
Spotify Wrapped: These guys have got data storytelling down to a fine art. You no longer have to wonder what you listen to the most. Music streaming giant, Spotify, presents you with your personal listening statistics in early December every year. It’s a beautifully customised, shareable, audio-visual presentation replete with some amusing, killer copy.
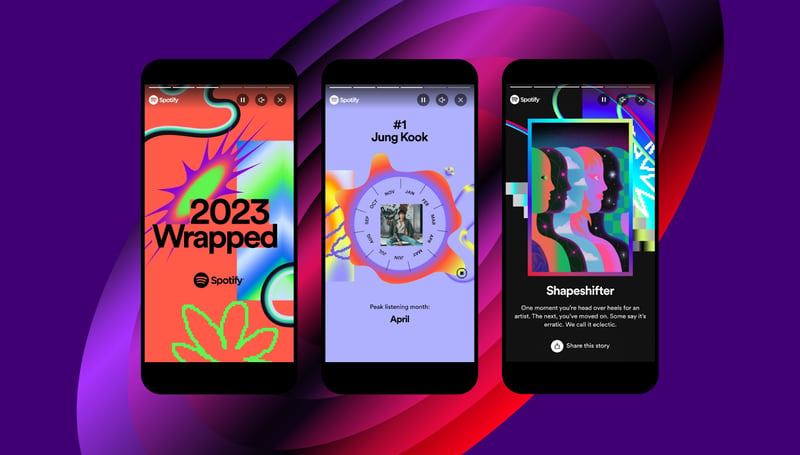
[Courtesy of Spotify Newsroom]
NZ Labour Day Data: NZ news website, Stuff, uses some seriously fun scrolling to make voting stats sexy (yes, you read that right) in this interactive article. The Marine Stewardship Council used similar technology to make its case to end overfishing.
Chit Chart: C’mon. These guys are using a fun stat visualisation to make you pay attention to their cookies notice – and it works! Their website is a feast of creative presentations of stats that will inspire your own data sharing.
[Courtesy of Chit Chart]
Buy Rent Calculator: This could have been a lengthy article about the pros and cons of buying or renting a home, but by using interactive calculators, The New York Times was able to have an in-depth conversation with its audience about finances and real estate.
It’s clear that storytelling and data as forms of communication are not so much oil and water as peas and carrots, especially in modern b2b marketing.
Data storytelling not only strengthens your credibility but also showcases your ability to creatively communicate and connect with your audience. Narratives that include stats with personal relevance to the reader can compel your audience to take action. To learn more about how to add data to your stories to level-up your marketing impact, appeal and competitive advantage, get in touch with us here.

Creating captivating b2b infographics that can charm and inform simultaneously can sometimes be a bit like geo tagging Dory from Finding Nemo. Where...

Does the thought of a b2b newsletter have you yawning? We hear you! They’ve developed quite a bad rap, with people clicking delete or unsubscribe as...

According to a study by the Content Marketing Institute, 88% of b2b marketers are using content marketing in their marketing mix. However, only 32%...