

Creating captivating b2b infographics that can charm and inform simultaneously can sometimes be a bit like geo tagging Dory from Finding Nemo. Where do you even start?
Surely you’d love it to be useful to your audience. But let's be real, you wouldn’t be devastated if it broke the internet! So what are the design practices you need to know to give your infographic the best chance at megastar virality?
1. Start your b2b infographics with a solid foundation
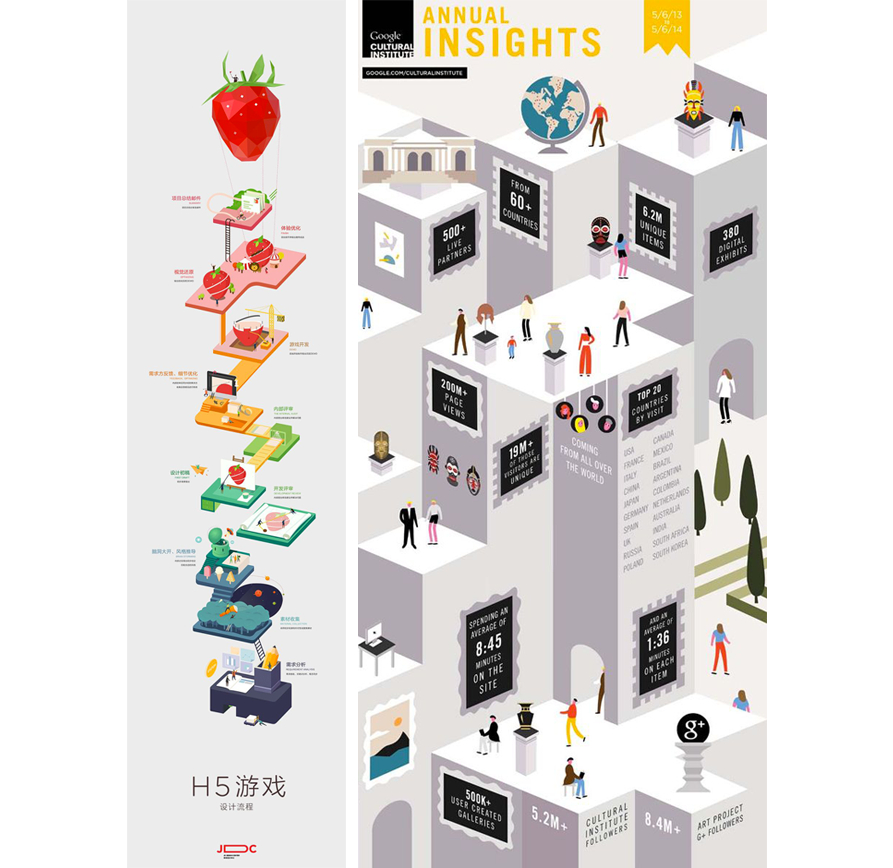
The process of creating b2b infographics is somewhat like constructing a building - it’s all about the architect's preparation and groundwork. Thoroughly planning your design will ensure a well organised and easy-to-digest visual that converts for you over and over, making it a valuable asset for your company.
It’s not by sheer luck. There are an array of design elements you can implement to make sure your infographic has the best chance at getting shares and likes. Since you’ll be spending a valuable chunk of time planning and constructing the infographic, you really don’t want it to fall short.
So let’s take a look at the design elements that will get more eyes on your infographic.
2. Crucial content
Even the best b2b designers can’t do anything if they don’t have a story to tell. That’s why you need to carefully think through your content before considering the visual elements.
Once the overall story is confirmed, spend some time considering the different approaches you can take. We find it’s best to have a solid plan before jumping into the design stage as infographics can take a lot of time and effort to create. Before you jump in:
- Don’t overwhelm the viewer with too many sources. Best practice for infographics is 100 - 500 words.
- Focus on relevant and meaningful content that your viewers can relate to and can use in their business. To do this, start by sketching ideas. Hold a brainstorming session with your team to make the idea more cohesive. By putting your team’s heads together, you might conceive an interesting visual metaphor that blends two different ideas.
3. Easy on the eyes
b2b infographics are perfect when you need to relate a lot of data to your audience in an easy to understand way. To do this:
- Keep it short and sweet. We live in an age of busy-ness and content overload. Consolidate information that focuses on a single idea.
- Share facts in bullet points. It makes it easier to copy and paste information into social media.
- Ensure your font styles and sizes are easily read on a variety of devices and test this before you publish.
- Design vertically.
- Keep infographics at a standard 600px wide to make it easier to insert into marketing emails.
Make your visuals easily digestible for people who aren't experts, this makes it much more likely for them to share your content. Use white space to spread out your content to make it scannable for the viewer. White space is the negative or unused space around each object in your design that helps your infographic look less crowded and more balanced:
4. First impressions
Design a great headline and a stellar first image. The lead opening and visual is where you’ll rope in your audience and persuade them to keep scrolling. The header should powerfully describe the infographic and grab the viewer's attention straight away. Try to incorporate the theme of the infographic into the title design.

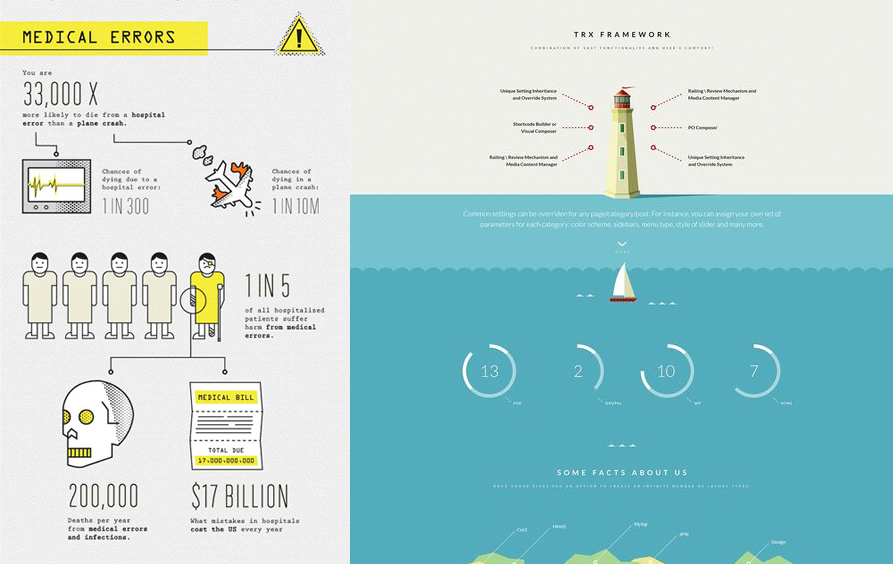
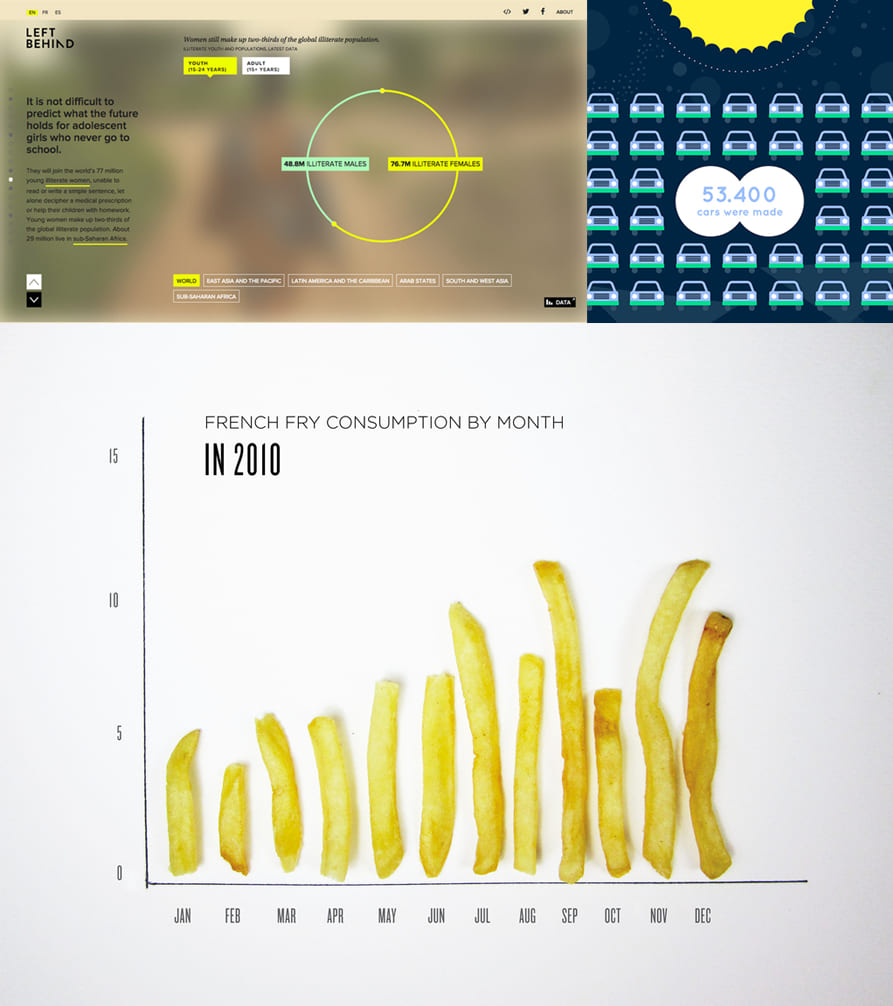
5. Diagrams and data
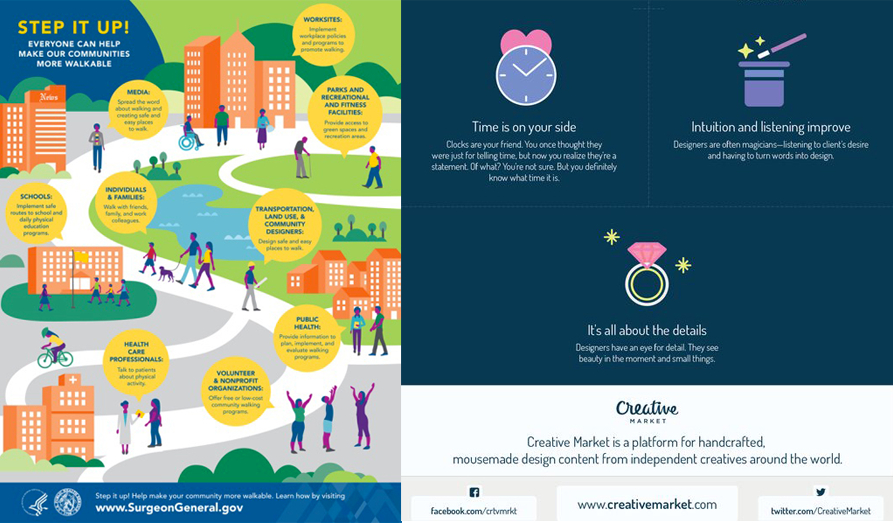
The use of relevant diagrams and data will help increase shares. Interesting facts and significant data lure your viewer into wanting to find out more about the topic. You can also use ‘pull-out’ sections of the design to highlight data, influencer quotes or provocative statements. Arrange these features to stand out among the rest of the design.
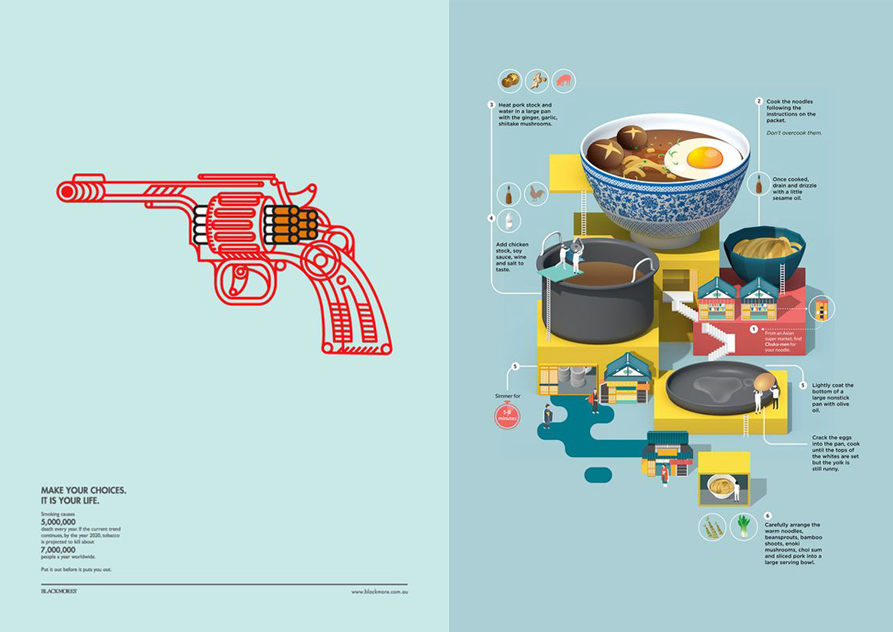
6. Colour trends
Bright, bold and contrasting colours can help to keep your design interesting. It’s best to avoid adding too many colours to your design. When undertaking infographic colour selection, avoid using any more than 4 colours, with 1-2 colours being the main feature hues. You could experiment by using an array of shades to incorporate more tone and depth, while still sticking to a limited colour palette. The idea behind this is to avoid putting strain on the eyes, while using an appealing colour scheme to make your infographic visually engaging.
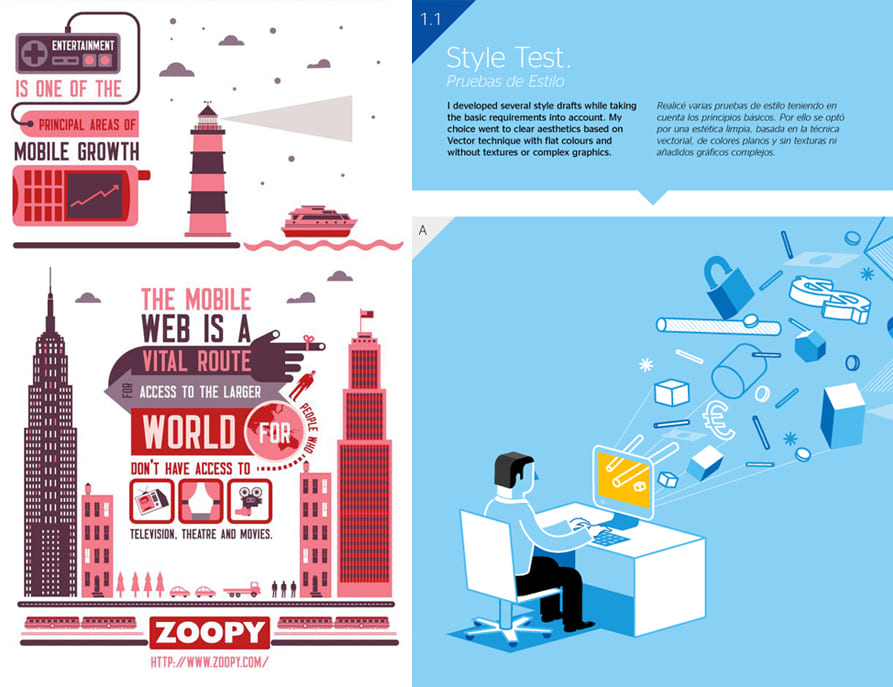
7. The narrative
Tell a story through illustration. While research is key, the way to stand out is to find a unique path that is distinguishes your content from other infographics. Infographics are usually required to solve some kind of problem your viewer is experiencing. So, much like an explainer video, your infographic can present the facts and problems and guide your viewer to a solution. Create a visual flow that smoothly guides the eye to the next section or fact. Try to present the solution by the end of the infographic.
8. Sharing is caring
Always offer clear call-to-actions and social sharing opportunities throughout your b2b infographics, but remember to place a call-to-action at the end of your design. If your viewers love your content they’ll naturally feel the urge to share it with someone they think will appreciate it. Embrace the fact that most people love getting credit points for showing another person something new.
Final words
While b2b infographics can be costly and timely to produce, they have proven to be valuable visual assets that, once circulating online, can perform for you by leaving an impression on your audience again and again. Give your infographics the best chance to go viral by following the design tips we’ve covered.

Brand chemistry is a b2b marketing agency winning your customers' hearts and minds through inbound, brand, content, lead generation and digital strategy. Our marketing specialists achieve stellar results with the latest lead generation techniques.